The increasing need for manual testing has led to an increase in the utilization of F12 Developer Tools at various stages of the web development life cycle. Owing to their ability to identify errors, these technology-driven tools are and will always remain the key to the 21st-century IT environment as the next breakthrough.
Formerly known as Internet Explorer Developer Toolbar, the F12 is an essential addition in the toolkit of testers and developers to deal with inconsistencies and unresolvable bugs. From the identification of red-flag potential errors to monitoring performance, F12 testing tools opening the roadmap to actionable insights for manual testers in the real-time.
Ways in which F12 Developer Tools can make discernible impacts in Quality Assurance and Software Testers:
Manual testing is an ongoing and incredibly complex process. Using F12 testing tools can substantially accelerate the traditional software development lifecycle (SDLC) in the following ways. These include:
1. UI Reboot

The tool has a fairly consistent UI that is available as a scrolling ribbon on the left side of the debugger panel. Testers can leverage the clean and intuitive graphics-based navigation system to access dropdown menus and a tab-based metaphor to run a series of quick tests.
2. DOM Explorer:
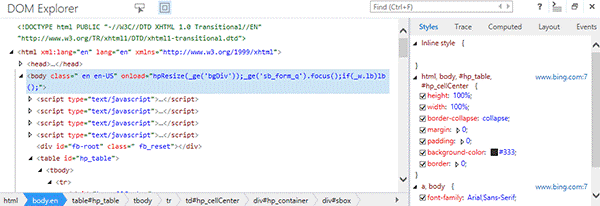
All new and improved DOM inspector tool brings a hassle-free debugging experience to make developers’ and testers’ lives a lot easier from a debugging perspective. It allows to right-click on any element on a page, inspect that element and drag an element to another location within the DOM explorer. In addition to these great features, it has Intellisense which gives easy access to style rules.
3. Tackling UI Responsiveness:
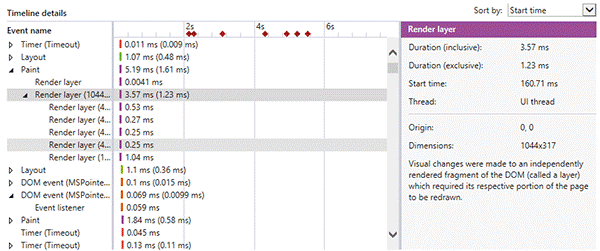
Now, developers and testers can easily measure the framerates and CPU usage in the page load cycle by using F12’s UI Responsiveness tool and identify any UI performance issues. Using the Timeline details panel, get details about how specific events/ network requests affecting the page performance. Also, they can leverage the feature to look at every element and track specific actions such as styling that play a major role in affecting the rendering performance.
4. Script Debugger:
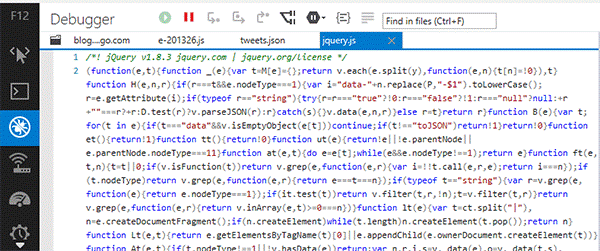
This new feature of F12 testing application is super helpful primarily in case of a UX issue. Using the Script Debugger, testers can easily work without any frustrating experience of the entire tools panel which pop-off in the browser viewport. Additionally, in the new version, there is a tab metaphor that allows us to view each open file in a sorted way and making navigation substantially easier. And it’s truly amazing how new tools support Tracepoints required to monitor specific values.
5. Memory Analysis:
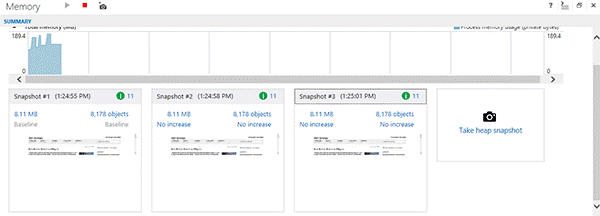
There will be no Pegging memory-related issues with the all-new and enhanced F12 tools. By using the new memory profiler, testers can conveniently take snapshots of your site or app’s memory usage and create a baseline snapshot of memory footprint along with subsequent snapshots to run a data comparison.
Surely, F12 Developer tools are one of the most exciting disruptors in the IT ecosystem for Quality Assurance experts and software testers and harnessing their full potential can make a marked difference.
For more reviews on testing software, quality assurance applications, latest technology news, keep browsing Technology and Internet Trends on Insight Glimpse.